
Stopping Resistance Drift in Phase Change Memory Cells and Analysis of Charge Transport in Stable Amorphous Ge 2Sb2Te5 Md Tashfiq Bin Kashem Raihan Sayeed Khan ABM Hasan Talukder Faruk Dirisaglik and Ali Gokirmak


StoppingResistanceDriftinPhaseChangeMemoryCellsandAnalysisofChargeTransportinStableAmorphousGe2Sb2Te5MdTashfiqBinKashem*,RaihanSayeedKhan*,ABMHasanTalukder,FarukDirisaglikandAliGokirmakDepartmentofElectricalandComputerEngineering,UniversityofConnecticut,Storrs,CT06269,USA.*Equalcontribution.Email:al...
相关推荐
-
架构演进:小米的经验分享VIP免费

 2025-03-31 26
 -
Chemical Evolution of Fluorine in the Milky Way Kate A. Womack1Fiorenzo Vincenzo1Brad K. Gibson1Benoit Côté23Marco Pignatari3110
 2025-09-29 16
 -
Chemical evolution of elliptical galaxies I supernovae and AGN feedback Marta Molero12Francesca Matteucci123Luca Ciotti4
 2025-09-29 17
 -
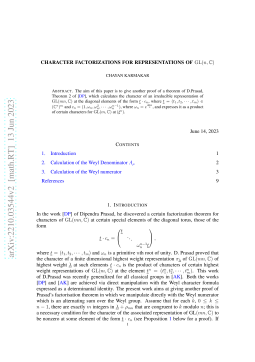
CHAYAN KARMAKAR ABSTRACT . The aim of this paper is to give another proof of a theorem of D .Prasad
 2025-09-29 19
 -
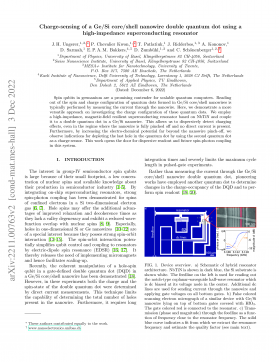
Charge-sensing of a GeSi coreshell nanowire double quantum dot using a high-impedance superconducting resonator
 2025-09-29 17
 -
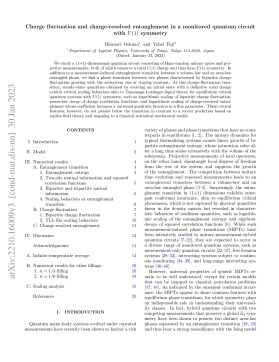
Charge uctuation and charge-resolved entanglement in a monitored quantum circuit with U1symmetry
 2025-09-29 20
 -
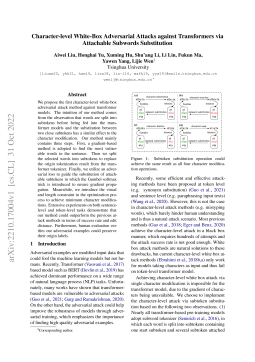
Character-level White-Box Adversarial Attacks against Transformers via Attachable Subwords Substitution
 2025-09-29 21
 -
Certifying randomness in quantum state collapse Liang-Liang Sun1Xingjian Zhang2Xiang-Zhou1Zheng-Da Li34
 2025-09-29 20
 -
CERTIFIED ROBUSTNESS OF QUANTUM CLASSIFIERS AGAINST ADVERSARIAL EXAMPLES THROUGH QUANTUM NOISE
 2025-09-29 19
 -
Certified machine learning Rigorous a posteriori error bounds for PDE defined PINNs
 2025-09-29 20
作者详情

相关内容
-
Charge uctuation and charge-resolved entanglement in a monitored quantum circuit with U1symmetry
分类:图书资源
时间:2025-09-29
标签:无
格式:PDF
价格:10 玖币
-
Character-level White-Box Adversarial Attacks against Transformers via Attachable Subwords Substitution
分类:图书资源
时间:2025-09-29
标签:无
格式:PDF
价格:10 玖币
-
Certifying randomness in quantum state collapse Liang-Liang Sun1Xingjian Zhang2Xiang-Zhou1Zheng-Da Li34
分类:图书资源
时间:2025-09-29
标签:无
格式:PDF
价格:10 玖币
-
CERTIFIED ROBUSTNESS OF QUANTUM CLASSIFIERS AGAINST ADVERSARIAL EXAMPLES THROUGH QUANTUM NOISE
分类:图书资源
时间:2025-09-29
标签:无
格式:PDF
价格:10 玖币
-
Certified machine learning Rigorous a posteriori error bounds for PDE defined PINNs
分类:图书资源
时间:2025-09-29
标签:无
格式:PDF
价格:10 玖币

