
matplotlib_users_guide_0.90.0
VIP免费
2025-03-03
7
0
3.01MB
101 页
5.9玖币
侵权投诉
The Matplotlib User’s Guide
John Hunter
and
Darren Dale
May 27, 2007
2
Contents
1 Introduction 5
1.1 Migrating from MATLABTM ....................................... 6
2 Installation and Setup 9
2.1 Installing ................................................. 9
2.1.1 Quickstart on windows ...................................... 9
2.1.2 Package managers: (rpms, apt, fink) ............................... 9
2.1.3 Compiling matplotlib ....................................... 10
2.1.4 Trial Run ............................................. 11
2.2 Backends ................................................. 11
2.3 Integrated development environments .................................. 12
2.4 Interactive ................................................. 12
2.5 Numerix .................................................. 14
2.5.1 Choosing Numeric, numarray, or NumPy ............................ 14
2.6 Customization using matplotlibrc ................................... 15
2.6.1 RC file format .......................................... 15
2.6.2 Which rc file is used? ....................................... 15
2.6.3 Getting feedback from matplotlib ................................ 16
3 The pylab interface 17
3.1 Simple plots ................................................ 17
3.2 More on plot ............................................... 19
3.2.1 Multiple lines ........................................... 19
3.2.2 Controlling line properties .................................... 20
3.3 Color arguments .............................................. 22
3.4 Loading and saving data ......................................... 22
3.4.1 Loading and saving ASCII data ................................. 22
3.4.2 Loading and saving binary data ................................. 23
3.4.3 Processing several data files ................................... 24
3.5 axes and figures .............................................. 24
3.5.1 figure .............................................. 24
3.5.2 subplot ............................................. 25
3.5.3 axes ............................................... 27
3.6 Text .................................................... 29
3.6.1 Basic text commands ....................................... 29
3.6.2 Text properties .......................................... 29
3.6.3 Text layout ............................................ 30
3.6.4 mathtext .............................................. 32
3.6.5 Annotations ............................................ 33
3.7 Images ................................................... 36
3
3.7.1 Axes images ........................................... 36
3.7.2 Figure images ........................................... 38
3.7.3 Scaling and color mapping .................................... 38
3.7.4 Image origin ........................................... 39
3.8 Bar charts, histograms and errorbar plots ................................. 40
3.8.1 Broken bar charts ......................................... 40
3.9 Polar charts ................................................ 41
3.10 Pseudocolor and scatter plots ....................................... 43
3.11 Spectral analysis ............................................. 43
3.12 Axes properties .............................................. 45
3.13 Legends and tables ............................................ 45
3.14 Navigation ................................................. 45
3.14.1 Classic toolbar .......................................... 45
3.14.2 toolbar2 .............................................. 45
3.15 Event handling .............................................. 46
3.16 Customizing plot defaults ......................................... 48
4 Font finding and properties 49
5 Collections 53
6 Tick locators and formatters 55
6.1 Tick locating ............................................... 55
6.2 Tick formatting .............................................. 56
6.3 Example 1: major and minor ticks .................................... 56
6.4 Example 2: date ticking .......................................... 58
7 Interactive object picking 61
7.1 Picking with a lasso tool ......................................... 63
8 Custom objects and units 67
9 Cookbook 73
9.1 Plot elements ............................................... 73
9.1.1 Horizontal or vertical lines/spans ................................. 73
9.1.2 Fill the area between two curves ................................. 73
9.1.3 Drawing true ellipses and circles ................................. 73
9.2 Text .................................................... 74
9.2.1 Adding a ylabel on the right of the axes ............................. 74
9.3 Data analysis ............................................... 75
9.3.1 Linear regression ......................................... 75
9.3.2 Polynomial regression ...................................... 76
9.4 Working with images ........................................... 77
9.4.1 Loading existing images into matplotlib ............................. 77
9.4.2 Blending several axes images using alpha ............................ 78
9.4.3 Creating a mosaic of images ................................... 79
9.4.4 Defining your own colormap ................................... 80
9.5 Output ................................................... 80
9.5.1 Printing to standard output .................................... 80
4
10 Matplotlib API 81
10.1 The matplotlib backends ......................................... 81
10.1.1 The renderer and graphics context ................................ 82
10.1.2 The figure canvases ........................................ 83
10.2 The matplotlib Artists ........................................... 83
10.3 pylab interface internals .......................................... 83
A A sample matplotlibrc 89
B mathtext symbols 95
C matplotlib source code license 97
5

摘要:
展开>>
收起<<
TheMatplotlibUser'sGuideJohnHunterandDarrenDaleMay27,20072Contents1Introduction51.1MigratingfromMATLABTM.......................................62InstallationandSetup92.1Installing.................................................92.1.1Quickstartonwindows......................................92.1.2Pac...
声明:本站为文档C2C交易模式,即用户上传的文档直接被用户下载,本站只是中间服务平台,本站所有文档下载所得的收益归上传人(含作者)所有。玖贝云文库仅提供信息存储空间,仅对用户上传内容的表现方式做保护处理,对上载内容本身不做任何修改或编辑。若文档所含内容侵犯了您的版权或隐私,请立即通知玖贝云文库,我们立即给予删除!
相关推荐
-
网络营销技巧分享VIP免费
 2025-02-28 10
 -
最系统销售培训资料VIP免费
 2025-02-28 8
 -
最系统的房地产销售培训资料VIP免费
 2025-02-28 9
 -
资深业务人员的谈判技巧VIP免费
 2025-02-28 7
 -
珠宝终端店销售培训VIP免费
 2025-02-28 8
 -
中国移动客服亲和力电话营销培训VIP免费
 2025-02-28 7
 -
医药代表专业销售技巧培训VIP免费
 2025-02-28 6
 -
医药代表销售技巧高级培训VIP免费
 2025-02-28 9
 -
医药代表培训宝典(最新)VIP免费
 2025-02-28 9
 -
新入职大学生培训方案全套VIP免费
 2025-02-28 9
分类:计算机
价格:5.9玖币
属性:101 页
大小:3.01MB
格式:PDF
时间:2025-03-03
作者详情
相关内容
-
淘宝直播红人经纪合同-9页
分类:人力资源/企业管理
时间:2025-06-11
标签:无
格式:DOC
价格:10 玖币
-
淘宝在线客服培训资料【精华整理版】-10页
分类:人力资源/企业管理
时间:2025-06-11
标签:无
格式:DOC
价格:10 玖币
-
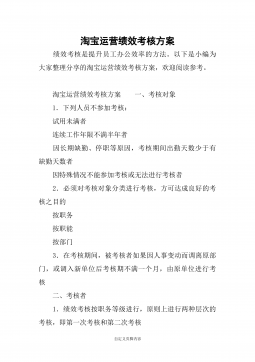
淘宝运营绩效考核方案-8页
分类:人力资源/企业管理
时间:2025-06-11
标签:无
格式:DOCX
价格:10 玖币
-
淘宝运营方案-11页
分类:人力资源/企业管理
时间:2025-06-11
标签:无
格式:DOCX
价格:10 玖币
-
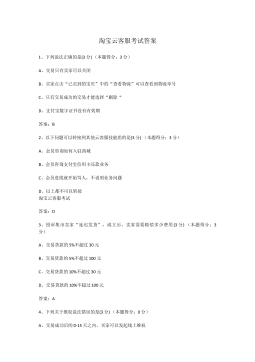
淘宝云客服考试答案-7页
分类:人力资源/企业管理
时间:2025-06-11
标签:无
格式:DOCX
价格:10 玖币

