
Imaging the electron charge density in monolayer MoS 2 at the Ångstrom scale Joel Martis1 Sandhya Susarla234 Archith Rayabharam5 Cong Su61011 Timothy Paule61011 Philipp
2025-05-08
9
0
479.21KB
26 页
10玖币
侵权投诉

Imaging the electron charge density in monolayer MoS2 at the Ångstrom
scale
Joel Martis1
*
, Sandhya Susarla2,3,4*, Archith Rayabharam5, Cong Su6,10,11, Timothy Paule6,10,11, Philipp
Pelz2,7, Cassandra Huff8, Xintong Xu1, Hao-Kun Li1, Marc Jaikissoon8, Victoria Chen8, Eric Pop8,
Krishna Saraswat8, Alex Zettl6,10,11, Narayana R. Aluru9, Ramamoorthy Ramesh6,10, Peter Ercius2
†
, Arun
Majumdar1
‡
1Department of Mechanical Engineering, Stanford University
2The National Center for Electron Microscopy (NCEM), The Molecular Foundry, Lawrence Berkeley
National Laboratory
3Materials Science Division, Lawrence Berkeley National Laboratory
4School for Engineering of Matter, Transport and Energy, Arizona State University
5Department of Mechanical Engineering, University of Illinois Urbana-Champaign
6Department of Physics, University of California Berkeley
7Institute of Micro- and Nanostructure Research & Center for Nanoanalysis and Electron Microscopy
(CENEM), Department of Materials Science, Friedrich-Alexander-Universität Erlangen-Nürnberg
(FAU), Erlangen, Germany
8Department of Electrical Engineering, Stanford University
9Department of Mechanical Engineering, The University of Texas at Austin
10Department of Materials Science and Engineering, University of California Berkeley
11Kavli Energy NanoScience Institute, University of California Berkeley
*
These authors contributed equally to this work
†
corresponding author (email: percius@lbl.gov)
‡
corresponding author (email: amajumdar@stanford.edu)

Abstract: Four-dimensional scanning transmission electron microscopy (4D-STEM) has recently
gained widespread attention for its ability to image atomic electric fields with sub-Ångstrom
spatial resolution. These electric field maps represent the integrated effect of the nucleus, core
electrons and valence electrons, and separating their contributions is non-trivial. In this paper, we
utilized simultaneously acquired 4D-STEM center of mass (CoM) images and annular dark field
(ADF) images to determine the projected electron charge density in monolayer MoS2. We
measure the contributions of both the core electrons and the valence electrons to the derived
electron charge density; however, due to blurring by the probe shape, the valence electron
contribution forms a nearly featureless background while most of the spatial modulation comes
from the core electrons. Our findings highlight the importance of probe shape in interpreting
charge densities derived from 4D-STEM and the need for smaller electron probes.
Introduction
Four-dimensional scanning transmission electron microscopy (4D-STEM) has become a
versatile tool in recent years with applications ranging from measuring nanoscale strain to
uncovering thermal vibrations of atoms1. One such 4D-STEM technique measures local electric
fields by calculating the center of mass (CoM) of the diffraction pattern2. In the past few years,
sub-Ångstrom electric field and charge density mapping using 4D-STEM CoM imaging has
become feasible due to aberration-corrected STEMs and fast pixelated detectors3–8. Atomic
electric fields emerge from a combination of strong nuclear effects and weak valence electrons
that form chemical bonds. The ability to map valence electrons with high spatial resolution can
potentially lead to new insights about chemical bonding, charge transfer effects, polarization,
ferroelectricity, ion transport, and much more9,10.
Imaging valence electrons at the atomic scale is a non-trivial problem. Annular dark field (ADF)
STEM, for example, images atom positions based on the high-angle scattering of incident
electrons by the nucleus11,12. Phase contrast high resolution (HR-) TEM can reveal chemical
bonding effects due to charge redistribution, but electron orbital charge densities have not been
explicitly imaged13. Electron holography can yield atomic scale potentials and charge densities;
however, the nuclear and electronic effects are non-trivial to separate and electron orbitals
haven’t been explicitly imaged14. Core-loss electron energy loss spectroscopy (EELS) can
identify core electron states at atomic resolution15 but cannot measure their charge density
directly. Valence EELS (VEELS) is limited by the delocalization of the excitation on the
nanometer scale, much larger than the size of the valence orbitals themselves16. Although recent
VEELS work has shown atomic-scale contrast in certain energy ranges in graphene, the contrast
is a function of inelastic scattering cross sections between different orbitals and sample
thickness, making it non-trivial to isolate valence electron charge densities17,18. Valence electron
densities are commonly measured using scanning tunneling microscopy (STM)19, but these are
limited to surfaces and energy ranges typically only a few eV below the Fermi level20. While
previous efforts have shown that electron contributions are important in 4D-STEM images3,7, the
electron charge density hasn’t been explicitly imaged so far.
In this paper, we use monolayer two-dimensional 2H-MoS2 as a model system to investigate the
contributions of atomic electric fields and charge densities in a 4D-STEM dataset. In particular,
we show how the ADF-STEM intensity channel can be used to subtract the nuclear contribution
from the total charge density derived from 4D-STEM and derive the electron charge density in
MoS2. Our experimental results show good agreement with the electron charge density predicted
by density functional theory (DFT). We discuss how both core electrons and valence electrons
contribute to the derived electron charge density, and how probe convolution (i.e., blurring by
the incident probe intensity distribution) results in core electrons dominating the measured
electron charge density map. We also discuss how residual aberrations in the instrument can
have a sizeable impact on the charge density image. Our findings point towards a need for
smaller electron probes and precise probe deconvolution methods that could potentially
distinguish between valence and core electrons based on orbital size.
Results
4D-STEM of monolayer MoS2. A 4D-STEM dataset is acquired by scanning a focused electron
probe across a sample and using a pixelated detector to image the scattered electron beam at each
probe position (Fig. 1). It has been shown using Ehrenfest’s theorem that the CoM of the
scattered electron beam at each probe position is directly proportional to the projected electric
field at that probe position convolved with the probe intensity2. Therefore, one can derive a 2D
electric field map of a sample by simply computing the CoM of the scattered electron beam at
every probe position as it scans across a sample. This electric field map can then be converted
into a projected charge density image and an electrostatic potential image of the sample using
Gauss’ law.
Here, we derive atomic electric field maps of monolayer MoS2 using 4D-STEM CoM imaging.
A monolayer of MoS2 is a two-dimensional direct bandgap semiconductor in its 2H phase where
the Mo atoms are sandwiched between two S atoms (Fig. 1a). The semiconducting nature and
direct band gap are useful for optoelectronics and catalysis applications17,18. Figure 1b shows an
ADF-STEM image of a super-cell of MoS2. Simultaneously, the transmitted beam intensity is
imaged using a high speed 4D-STEM camera21, and the CoM of the diffraction pattern at each
probe position is computed, leading to Fig. 1c and 1d. The camera is a direct electron detector
and allows for high quantum efficiency data collection at high speeds, which is critical when
imaging beam sensitive materials such as monolayer MoS2. Figures 1b-d represent unit cell
averages over about 25 super-cells from a larger scan area which significantly improves the
signal-to-noise ratio (SNR) (see Supplementary Figure 3).
Since the CoM of the transmitted electron beam in each diffraction pattern is proportional to the
projected electric field at the sample, the experimental projected electric field map in Fig. 2a is
derived by simply multiplying the CoM images with appropriate physical constants, following
reference 2. The intensities of the image pixels represent the magnitude of the electric field, and
the arrows represent its direction. We observe that the centers of lattice sites, midpoints between
neighboring atoms, and the center of the hexagonal cells show zero electric field in agreement
with previously reported works6,8. Using the projected electric field, we computed the projected

摘要:
展开>>
收起<<
ImagingtheelectronchargedensityinmonolayerMoS2attheÅngstromscaleJoelMartis1*,SandhyaSusarla2,3,4*,ArchithRayabharam5,CongSu6,10,11,TimothyPaule6,10,11,PhilippPelz2,7,CassandraHuff8,XintongXu1,Hao-KunLi1,MarcJaikissoon8,VictoriaChen8,EricPop8,KrishnaSaraswat8,AlexZettl6,10,11,NarayanaR.Aluru9,Ramamoo...
声明:本站为文档C2C交易模式,即用户上传的文档直接被用户下载,本站只是中间服务平台,本站所有文档下载所得的收益归上传人(含作者)所有。玖贝云文库仅提供信息存储空间,仅对用户上传内容的表现方式做保护处理,对上载内容本身不做任何修改或编辑。若文档所含内容侵犯了您的版权或隐私,请立即通知玖贝云文库,我们立即给予删除!
相关推荐
-
机器人技术讲稿第八章 机器人编程VIP免费

 2024-12-10 13
 -
1,PCB专业用语VIP免费

 2024-12-10 13
 -
7,通信高频开关电源系统VIP免费
 2024-12-10 13
 -
单片微型计算机原理及接口技术第00章 目录VIP免费
 2024-12-10 16
 -
交大电气-信号与系统分析《信号与系统》期末-简单卷2000年VIP免费
 2024-12-10 15
 -
交大电气-信号与系统分析《信号与系统》期末-简单卷2001年VIP免费
 2024-12-10 15
 -
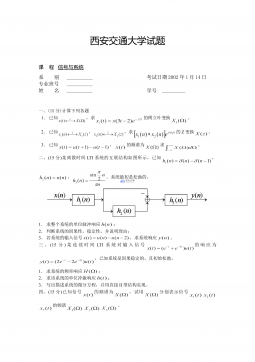
交大电气-信号与系统分析《信号与系统》期末-简单卷2002年VIP免费
 2024-12-10 14
 -
文献检索、调研、获取、管理方法医学文献和文献检索概论VIP免费
 2024-12-10 18
 -
文献检索、调研、获取、管理方法第九章__综合VIP免费
 2024-12-10 17
 -
传感器原理及工程应用第10章 超声波传感器VIP免费
 2024-12-10 16
分类:图书资源
价格:10玖币
属性:26 页
大小:479.21KB
格式:PDF
时间:2025-05-08
作者详情

相关内容
-

5.江苏省扬州市扬州中学高三年级物理学科高考模拟试卷
分类:高等教育
时间:2025-01-03
标签:无
格式:DOC
价格:5.9 玖币
-
4.湖南省衡阳市高三年级物理学科高考模拟试卷
分类:高等教育
时间:2025-01-03
标签:无
格式:DOC
价格:5.9 玖币
-
3.河北省沧州市第一中学高三年级物理学科高考模拟试卷
分类:高等教育
时间:2025-01-03
标签:无
格式:DOC
价格:5.9 玖币
-
2.广东省潮州市高三年级物理学科高考模拟试卷
分类:高等教育
时间:2025-01-03
标签:无
格式:DOC
价格:5.9 玖币
-

1.北京市第二中学高三年级物理学科高考模拟试卷
分类:高等教育
时间:2025-01-03
标签:无
格式:DOC
价格:5.9 玖币

