
Ion-acoustic feature of collective Thomson scattering in non-equilibrium two-stream plasmas K. Sakai1aT. Nishimoto1S. Isayama2S. Matsukiyo2and Y. Kuramitsu1b
2025-05-03
1
0
4.02MB
10 页
10玖币
侵权投诉

Ion-acoustic feature of collective Thomson scattering in non-equilibrium
two-stream plasmas
K. Sakai,1, a) T. Nishimoto,1S. Isayama,2S. Matsukiyo,2and Y. Kuramitsu1, b)
1)Graduate School of Engineering, Osaka University, 2-1 Yamadaoka, Suita, Osaka 565-0871,
Japan.
2)Department of Advanced Environmental Science and Engineering, Kyushu University, 6-1 Kasuga-Koen, Kasuga,
Fukuoka 816-8580, Japan.
(Dated: 20 December 2022)
We theoretically and numerically investigate the ion-acoustic features of collective Thomson scattering (CTS)
in two-stream plasmas. When the electron distribution functions of two (stationary and moving) components
overlap with each other at the phase velocities corresponding to the two resonant peaks of the ion-acoustic
feature, the theoretical spectrum shows asymmetry because the rate of electron Landau damping is different
for the two peaks. The results of numerical simulations agree well with the theoretical spectra. We also
demonstrate the effect of a two-stream-type instability in the ion-acoustic feature. The simulated spectrum
in the presence of the instability shows an asymmetry with the opposite trend to the overlapped case, which
results from the temporal change of the electron distribution function caused by the instability. Our results
show that two-stream plasmas have significant effects on CTS spectra and that the waves resulting from
instabilities can be observed in the ion-acoustic feature.
I. INTRODUCTION
Collisionless shocks are known to accelerate charged
particles to nonthermal energies. The formation of colli-
sionless shocks is mediated by electromagnetic fields due
to collective plasma effects rather than Coulomb colli-
sions. Since the width of a shock transition layer is
smaller than the Coulomb mean free path, multiple plas-
mas with different origins can coexist, especially in the
upstream regions of collisionless shocks.1Some of the up-
stream particles are reflected at the shock front, and the
upstream and reflected plasmas form a two-stream state.
The free energy of the two-stream state excites plasma
waves, and particles can be accelerated by wave-particle
interactions.1,2In some cases, the excited waves self-
organize into global structures in collisionless shocks.3,4
However, it is difficult to observe the multiscale nature
of collisionless shocks in space and astrophysical plas-
mas. This is because it is challenging to obtain images
of shocks with spacecraft in space plasmas and there are
no in-situ observations of distribution functions in as-
trophysical plasmas. Recently, collisionless shocks have
been studied with laboratory experiments that have the
potential to measure both global and local information
simultaneously.5,6
In laboratory experiments, collective Thomson scat-
tering (CTS) is widely used to measure local plasma pa-
rameters and distribution functions by observing the dis-
persion properties and amplitudes of waves.7CTS is a
parametric resonance that occurs among incident electro-
magnetic, scattered electromagnetic, and plasma waves.
There are two kinds of spectra in unmagnetized plas-
mas — resonances with Langmuir waves create electron
a)kentaro.sakai@eie.eng.osaka-u.ac.jp
b)kuramitsu@eei.eng.osaka-u.ac.jp
features, and those with ion-acoustic waves create ion-
acoustic features. Both of these have two peaks, asso-
ciated with waves propagating toward and against the
observation direction. In an electron feature, the wave-
length difference between peaks, the widths of the peaks,
and the Doppler shift correspond to the electron den-
sity, temperature, and velocity, respectively, when the
distribution function is Maxwellian. In an ion-acoustic
feature, the wavelength difference between peaks, the
widths of the peaks, the Doppler shift, and the asym-
metry in the peaks correspond to the sound velocity, ion
temperature, ion velocity, and velocity difference between
the electrons and ions, respectively. It is known that the
dynamic structure factor represents the CTS spectrum
in quasi-equilibrium plasmas.7The CTS spectra of non-
equilibrium plasmas are still a subject of investigation8–14
and the analysis of CTS spectra normally assumes the
distribution function to be Maxwellian. However, non-
equilibrium plasmas with distributions that are far from
Maxwellian are ubiquitous in high-energy phenomena,
such as collisionless shocks. In collisionless shock ex-
periments, CTS can be used to observe the structure of
shocks and sometimes two components of the ion fea-
ture, which correspond to the two-stream state.15–20 Al-
though non-equilibrium plasmas are essential in shock
formation and particle acceleration, most analyses as-
sume a Maxwellian distribution function. Therefore, in
this work, we investigate CTS for non-equilibrium plas-
mas and the resulting waves associated with collisionless
shocks.
We have previously investigated the electron features
of CTS in two-plasma states.12 When the relative drift
of two plasmas is larger than the electron thermal veloc-
ity, the CTS spectrum is not explained by the dynamic
structure factor and shows a large asymmetry reflecting
the directional wave generated by the two-stream-type
instability. In this paper, we focus on the ion-acoustic
arXiv:2210.11086v3 [physics.plasm-ph] 19 Dec 2022

2
features of CTS in two plasmas. We theoretically cal-
culate the CTS spectra in the two-plasma state in Sec.
II. When two electron distribution functions overlap with
each other, spectral asymmetry arises due to the differ-
ent rates of electron Landau damping for the two peaks.
We perform numerical simulations to calculate the CTS
spectra in Sec. III. In the presence of the electron two-
stream-type instability, we observe a new spectrum corre-
sponding to the excited wave and the spectral asymmetry
of the ion-acoustic feature due to the change in the elec-
tron distribution function. We provide a discussion and
summary of our research in Sec. IV.
II. DYNAMIC STRUCTURE FACTOR IN A
TWO-PLASMA STATE
We theoretically calculate the CTS spectrum in a two-
plasma state. We consider the electron and ion distribu-
tion functions to be the sum of two Maxwell distributions:
fe,i(v) = X
j
nj
e,i
ne,i
fj
e,i(v),(1)
where fj
e,i(v) and nj
e,i are the distribution function and
number density of the j-th plasma species, respectively.
The total number density is given by ne,i =Pjnj
e,i. The
individual distribution functions are written as fj
e,i(v) =
exp[−(v−vdj )2/v2
te,i]/(π1/2vte,i), where vdj is the j-th
drift velocity. We assume there are no net currents, so
J=Pj[(qenj
e+qinj
i)vdj ] = 0, where qe,i is the charge
of an electron or ion. The thermal velocity is given by
vte,i = (2kBTe,i/me,i)1/2, where kB,Te,i, and me,i are
the Boltzmann constant, temperature, and mass, respec-
tively. In this paper, we assume the temperatures of the
two components (electrons and ions) are the same for
simplicity. We set the ion-to-electron mass ratio to 100.
The reduced mass is employed to compare the dynamic
structure factor with the simulated spectrum in Sec. III.
The dynamic structure factor with a realistic mass ratio is
presented in Appendix A. The dynamic structure factor
that describes the spectral shape of Thomson scattering
near the equilibrium plasmas is expressed as7
S(k, ω) = 2π
k1−χe
ε
2feω
k+Z
χe
ε
2fiω
k.
(2)
The first and second terms on the right-hand side in
Eq. (2) are associated with the non-collective scattering
or Langmuir (electron plasma) waves and ion-acoustic
waves, respectively. The susceptibility χe,i is given by
χe,i =4πq2
e,ine,i
me,ik2Z∞
−∞
∂fe,i (v)
∂v
ω
k−vdv
=−4πq2
e,i
me,ik2X
j"nj
e,i
v2
te,i
Z0ω
k−vdj
vte,i #,
(3)
where Z0(ζ) is the derivative of the plasma dispersion
function. The wavenumber and frequency of the ob-
served density fluctuation are given by k=kS−kIand
ω=ωS−ωI, where kS,kI,ωS, and ωIare the scattered
wavenumber, incident wavenumber, scattered frequency,
and incident frequency, respectively. The dielectric func-
tion satisfies ε= 1+χe+χi. The peaks of the CTS spec-
trum are mainly determined by ε∼0, which represents
the resonant condition of parametric resonance. The dis-
persion relations of the Doppler-shifted ion-acoustic and
electromagnetic waves are given by (ω−k·vd)2=c2
Sk2
and ω2=ω2
p+c2k2, where vd,cS, and ωpare the flow
velocity, sound velocity, and plasma frequency, respec-
tively. Considering the dispersion relations and the res-
onant condition, we find the peak wavenumbers of the
CTS spectra kS±:
k2
S±'c2+ (vd±cS)2
c2−(vd±cS)2kIsin θ
2+2(vd±cS)
c2−(vd±cS)2ωI2
+k2
Icos2θ
2,
(4)
where θis the angle between the incident and scattered
wavenumbers. The peaks are determined not only by ε∼
0 but also by the electron susceptibility in the numerator
in Eq. (2). Substituting the dielectric function into the
absolute value term in Eq. (2), we get
χe
ε
2=
1
1 + x
2
=1
(1 + Re[x])2+ (Im[x])2,(5)
where x= (1 + χi)/χe. The peak is determined to be
at the wavenumber with the smallest denominator in Eq.
(5) where Re[x]∼ −1 and Im[x]∼0 are satisfied.
We plot Eqs. (1), (2), and (5) in Fig. 1with the param-
eters Te/(mec2)=2×10−3,Te1=Te2= 10Ti1= 10Ti2,
n1
e,i/n2
e,i = 1, Z= 1, vd1= 0, ckI/ωpe = 5, and θ= 90°.
We compare the spectra obtained from f=f1+f2
(S1+2) and the sum of the spectra obtained indepen-
dently from f1(S1) and f2(S2) by changing the drift
velocity vd2/vte = 0, 1, and 3. Figures 1(a)–1(c) show
the scattered spectrum in terms of the wavenumber shift,
∆k=kS−kI, normalized to ωpe/c, where ωpe is the
electron plasma frequency. The black, green dashed, red
dotted, and blue dotted curves in Figs. 1(a)–1(c) show
the CTS spectra of S1+2,S1+S2,S1, and S2, respec-
tively. The red and blue curves in Figs. 1(d)–1(f) are
the real and imaginary parts of (1 + χi)/χein terms of
the wavenumber shift, respectively. The resonant condi-
tion of Re[(1 + χi)/χe]∼ −1 is shown by the horizontal
red dashed line, and that of Im[(1 + χi)/χe]∼0 is shown
as the horizontal blue dashed line. We plot Eq. (4) as
the vertical dotted lines in Figs. 1(a)–1(f) as a criterion
of the peaks determined by Eq. (5). The insets in Figs.
1(b), 1(c), 1(e), and 1(f) are enlarged versions of the left
spectrum for ease of view. Figures 1(g)–1(i) represent the
electron (blue) and ion (red) distribution functions. The

摘要:
展开>>
收起<<
Ion-acousticfeatureofcollectiveThomsonscatteringinnon-equilibriumtwo-streamplasmasK.Sakai,1,a)T.Nishimoto,1S.Isayama,2S.Matsukiyo,2andY.Kuramitsu1,b)1)GraduateSchoolofEngineering,OsakaUniversity,2-1Yamadaoka,Suita,Osaka565-0871,Japan.2)DepartmentofAdvancedEnvironmentalScienceandEngineering,KyushuUni...
声明:本站为文档C2C交易模式,即用户上传的文档直接被用户下载,本站只是中间服务平台,本站所有文档下载所得的收益归上传人(含作者)所有。玖贝云文库仅提供信息存储空间,仅对用户上传内容的表现方式做保护处理,对上载内容本身不做任何修改或编辑。若文档所含内容侵犯了您的版权或隐私,请立即通知玖贝云文库,我们立即给予删除!
相关推荐
-
曲一线系列初中《5中考3年模拟》2023专题解释全国道德与法治资料包05专题五 走进社会生活 遵守社会规则VIP免费

 2024-11-21 24
 -
曲一线系列初中《5中考3年模拟》2023专题解释全国道德与法治资料包05专题五 走进社会生活 遵守社会规则VIP免费
 2024-11-21 24
 -
曲一线系列初中《5中考3年模拟》2023专题解释全国道德与法治资料包03专题三 青春时光 做情绪情感的主人VIP免费
 2024-11-21 16
 -
曲一线系列初中《5中考3年模拟》2023专题解释全国道德与法治资料包03专题三 青春时光 做情绪情感的主人VIP免费
 2024-11-21 22
 -
曲一线系列初中《5中考3年模拟》2023专题解释全国道德与法治资料包02专题二 友谊的天空 师长情谊VIP免费
 2024-11-21 19
 -
曲一线系列初中《5中考3年模拟》2023专题解释全国道德与法治资料包02专题二 友谊的天空 师长情谊VIP免费
 2024-11-21 20
 -
曲一线系列初中《5中考3年模拟》2023专题解释全国道德与法治资料包01专题一 成长的节拍 生命的思考VIP免费
 2024-11-21 25
 -
曲一线系列初中《5中考3年模拟》2023专题解释全国道德与法治资料包01专题一 成长的节拍 生命的思考VIP免费
 2024-11-21 24
 -
曲一线系列初中《5中考3年模拟》2023专题解释全国道德与法治资料包《53中考》全国道德与法治资料包VIP免费
 2024-11-21 27
 -
曲一线系列初中《5中考3年模拟》2023专题解释全国道德与法治资料包07专题七 坚持宪法至上 崇尚法治精神VIP免费
 2024-11-21 19
分类:图书资源
价格:10玖币
属性:10 页
大小:4.02MB
格式:PDF
时间:2025-05-03
作者详情

相关内容
-
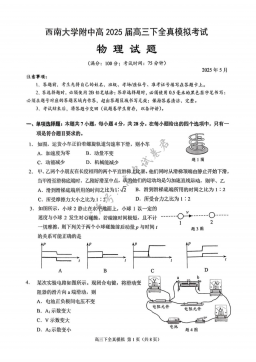
2025届重庆市西南大学附属中学高三下学期5月全镇模拟物理试题(含答案)
分类:中学教育
时间:2025-12-31
标签:无
格式:PDF
价格:10 玖币
-
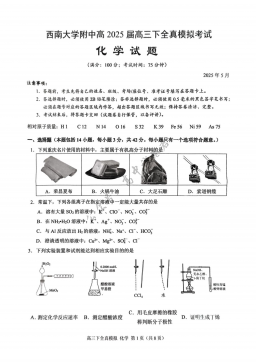
2025届重庆市西南大学附属中学高三下学期5月全镇模拟化学试题(含答案)
分类:中学教育
时间:2025-12-31
标签:无
格式:PDF
价格:10 玖币
-
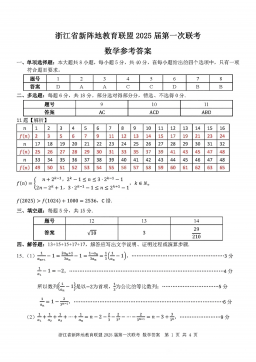
2025届浙江省新阵地联盟高三10月联考数学答案
分类:中学教育
时间:2025-12-31
标签:无
格式:PDF
价格:10 玖币
-
2025届重庆市西南大学附属中学高三下学期5月全镇模拟数学试题(含答案)
分类:中学教育
时间:2025-12-31
标签:无
格式:PDF
价格:10 玖币
-

2025届重庆康德三诊英语+答案
分类:中学教育
时间:2026-01-03
标签:无
格式:PDF
价格:10 玖币

