
Partially Constrained Group Variable Selection to Adjust for Complementary Unit Performance in American College Football A. Skripnikova
2025-05-02
0
0
540.73KB
18 页
10玖币
侵权投诉

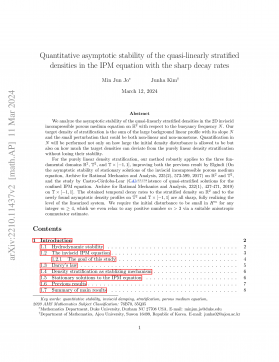
Partially Constrained Group Variable Selection to Adjust for
Complementary Unit Performance in American College Football
A. Skripnikova
aNew College of Florida, Sarasota, FL 34243, USA
ARTICLE HISTORY
Compiled October 25, 2022
ABSTRACT
Given the importance of accurate team rankings in American college football (CFB)
- due to heavy title and playoff implications - strides have been made to improve
evaluation metrics across statistical categories, going from basic averages (e.g. points
scored per game) to metrics that adjust for a team’s strength of schedule, but one
aspect that hasn’t been emphasized is the complementary nature of American foot-
ball. Despite the same team’s offensive and defensive units typically consisting of
separate player sets, some aspects of your team’s defensive (offensive) performance
may affect the complementary side: turnovers forced by your defense could lead to
easier scoring chances for your offense, while your offense’s ability to control the
clock may help your defense. For 2009-2019 CFB seasons1, we incorporate natural
splines with group penalty approaches to identify the most consistently influen-
tial features of complementary football in a data-driven way, conducting partially
constrained optimization in order to additionally guarantee the full adjustment for
strength of schedule and homefield factor. We touch on the issues arising due to
reverse-causal nature of certain within-game dynamics, discussing several potential
remedies. Lastly, game outcome prediction performances are compared across several
ranking adjustment approaches for method validation purposes.
KEYWORDS
group penalty, LASSO, natural splines, regularized estimation, reverse causality,
sports statistics
1. Introduction
American football, while requiring immense physical ability, is an example of an ex-
tremely strategic sport. Requiring full mental engagement on every play from all 11
players your team puts on the field, it underlines the importance of tactical prepara-
tion and accurate evaluation of the opposing team in advance of the match-up. Besides
that, in American college football specifically, the ability to objectively evaluate team
performance is pivotal for the purposes of rankings, with the latter fully dictating the
college teams that get into the championship playoffs and high-profile bowl games,
including all the financial benefits to come with it. Historically, classical averages have
been used to evaluate team’s performance in a certain statistical category [1]. For
example, American football team’s offensive output from yardage standpoint is tradi-
tionally measured in total yards the team gains per game; its tendency to turn the ball
CONTACT A. Skripnikov. Email: askripnikov@ncf.edu
1Data and source code files are made available at https://github.com/UsDAnDreS/SUBMISSIONS_OffenseST_
DefenseST_GLM_LASSO_adjusted_rankings
arXiv:2210.12519v1 [stat.AP] 22 Oct 2022
over to the opposing team is typically captured in their average turnover count per
contest; team’s pure scoring ability is ubiquitously described by an average amount of
points scored per game. While useful, such basic averages are extremely flawed when-
ever trying to objectively evaluate and compare teams within the setup of Football
Bowl Subdivision (FBS) of American college football.
Football Bowl Subdivision (FBS), as of year 2019, consists of 131 participating
college football programs, split into 11 conferences. Each team is typically scheduled
to play only 12 opponents during the regular season, with most of the games taking
place against the teams from the same conference, hence leaving the ranking picture
incomplete in terms of relative strengths for teams across the entire FBS. Certain
conferences could end up being especially strong, or weak, during a particular season,
leading to uneven quality of opposition which can’t be reflected in the calculating
each team’s basic per-game averages alone. That gave rise to what’s now known as
”strength of schedule” adjustment, originating in [14] via an offense-defense model
where points scored by a team are assumed to be a function that team’s offensive
strength and opposing team’s defensive strength, therefore adjusting for quality of the
opponent. Lastly, given the importance of home-field advantage [9, 24], in addition to
adjusting for strength of scheduled opponents [14] also accounted for whether a team
had a home- or road-heavy schedule.
In this work, besides the strength of schedule and homefield adjustments, we wanted
to also incorporate the complementary nature of American football. Unlike most other
sports, in American football offense and defense are played by separate, in most cases
non-overlapping, units of players, that can’t be on the field at the same time. It might
lead to an assumption that performance of a team’s offense could be treated indepen-
dently of that same team’s defense. Nonetheless, historically it’s been shown that the
two sides are likely to complement each other, e.g. turnovers forced by your defense
could lead to easier scoring chances for your offense, while your offense’s ability to
control the clock may help your defense. That concept has been termed ”complemen-
tary football”, and focus of this work was on determining the most critical features
of collegiate American football in affecting the complementary side’s performance.
Specifically, we utilized a variety of regularized estimation techniques that impose a
penalty for the purposes of variable selection, implementing partially constrained opti-
mization with the goal of guaranteeing strength of schedule and homefield adjustment.
Somewhat related ideas were studied in [3, 17] but in application to modelling the de-
pendence between goals scored and allowed by a team in a soccer match. To the best
of our knowledge, there hasn’t been any involved research done on complementary im-
pacts an American football offense can have on its own defense, and vice versa, after
having adjusted for strength of schedule and homefield factor.
The remainder of the paper is structured as follows. Section 2 lays out the details of
data collection and cleaning, formulates all regularized estimation approaches for the
purpose of finding the most critical complementary football features in affecting certain
statistical categories. The results of feature selection, ensuing ranking adjustments,
along with their impact on predicting game outcomes, are presented in Section 3.
Moreover, the issue of endogeneity is brought up, resulting from reverse causal within-
game dynamics of a football game, and several partial solutions discussed, main one
involving the use of solely efficiency-based statistics. Section 4 contains concluding
remarks and discussions of future work.
2
2. Materials and methods
2.1. Data collection and cleaning
Game-by-game data for 2009-2019 FBS seasons was obtained via web scraping from
two primary sources: www.sports-reference.com/cfb/ and www.cfbstats.com/.
The former website provides detailed scoring and defensive play, and has webpage
format conducive to seamless scraping of analysis-ready data tables into R Statistical
Software [21] - primary tool used for statistical analysis in this work - via rvest package
[26]. The latter website helped augment the data with more statistical measurements,
although it required a more profound web scraping effort while using RSelenium
package [13]. Certain defensive play statistics (e.g. tackles, sacks, forced fumbles) were
lacking for ”non-major” teams, meaning colleges not in the FBS. Despite rare occur-
rence of such observations (only about 7%), we wanted to incorporate all relevant
games into our analysis and, instead of removing them, we performed data imputation
[10] via linear regression. We regressed the missing statistics - e.g. sacks - on the other
statistical categories that were available for non-major teams (e.g. yards, touchdowns,
punts, etc), utilizing observations for all FBS teams in fitting this regression, to later
make predictions of that missing statistic for non-major teams.
Having obtained game-by-game data on teams’ performances in a multitude of sta-
tistical categories, we converted it into a format where each observation describes the
cumulative performance throughout the game whenever one team’s offensive side (of-
fense or offensive special teams) - and, consequently, opponent’s defensive side (defense
or defensive special teams) - was on the field. E.g. for this team’s offense, it would in-
clude yards gained, touchdowns scored, passes completed, field goals scored, etc, while
for opponent’s defense it would show total tackles, tackles for loss, sacks, quarter-
back hurries, etc. To clarify, ”offensive special teams” imply the field goal kicking and
kick/punt returning player sets, while ”defensive special teams” represent players par-
ticipating in field goal blocking and kick/punt coverage. That data format results into
two observations per each game, one representing plays produced when first team’s
offensive side (and second team’s defensive side) was on the field, second - when second
team’s offensive side (and first team’s defensive side) was on the field. This implies
potential within-game dependence introduced by such pairs of observations, but after
having calculated Intraclass Correlation Coefficients [2] across the models considered in
this paper, virtually none of those correlations ended up being over 0.10 in magnitude,
pointing to independence as a reasonable assumption for our data.
2.2. Variable selection methodology outline
Below we introduce the modeling notation and main variable selection approaches
to help adjust team’s offensive (or defensive) quality for the strength of schedule,
homefield factor, and complementary nature of American football.
2.2.1. Notation
Assume we have a total of nteams in the league, and we are interested in a particular
statistical category y, be it yards (per game), turnovers, points, etc. Let yij denote the
performance of team iagainst team jin category y,ni- total number of opponents
team ihas had through the season, i, j = 1, . . . , n. For example, if y={total yards
gained per game}, then yij would correspond to the amount of yards team igained
3
when playing against team j, and, by symmetry, the amount of yards team jallowed
in the game against team i. In case teams iand jhad to face each other Lij times
during the season, we add another index l. Then, yijl corresponds to performance of
team iin category xduring its lth meeting with team j,i, j = 1, . . . , n, l = 1, . . . , Lij .
Next, let hijl denote a homefield indicator for lth game between teams iand j,
taking on value 1 if team iis at home, 0 if the game site is neutral, −1 if team i
is at home. Such numerical encoding was intuitive (typically easier to play at home
than at a neutral site, and at a neutral site than on the road) and also got confirmed
by running a dummy-variable encoding scheme, having shown increases (in points,
touchdowns scored, yards gained) for home and decreases for road games compared to
the neutral site baseline.
To incorporate adjustment for strength of the schedule, we introduce concepts of of-
fensive (defensive) worth of the ”league-average opponent”, and offensive (defensive)
margin for a team. In regards to a particular statistical category y, one can define
the league-average opponent via two parameters - offensive and defensive worth. E.g.
for points per game, offensive (defensive) worth of the average opponent is the aver-
age points per game scored (allowed) by all teams across all games that could have
been played against one another throughout the course of the season. Due to sym-
metry (team iscoring yij points against team jis equivalent to team jallowing yij
points to team i), both offensive and defensive worth represent the same value for the
league-average opponent, which we denote as µ. Now, for each team iwe can posit
parameters capturing two aspects of its performance within a statistical category -
offensive margin αiand defensive margin βi. Offensive (defensive) margin describes by
how much a team would outperform the aforementioned defensive (offensive) worth µ
of the average opponent. The main assumption when adjusting for strength of schedule
is that performance of team iagainst team jin category yis attributable to both the
offensive margin αiof team iand defensive margin βjof team j.
Lastly, presuming that we consider Ccomplementary football statistics, let’s use
xc,jil, c = 1, . . . , C, to denote the value of cth statistic that’s complementary to the
yijl, meaning that xc,jil is obtained when the defense (complementary unit for the
offense) of ith team and offense (complementary unit for the defense) of jth team were
on the field during their lth game of the season between these two teams.
2.2.2. Natural cubic splines
To model potentially non-linear effects of complementary football features, as a well-
known method we utilized natural cubic splines [15], where one uses a mixture of piece-
wise cubic and linear polynomials, smoothly connected at a set of Kknots placed across
the range of the explanatory variable. It results into each complementary statistic xc
being represented by a set of basis functions N1(xc), N2(xc), . . . , NK−1(xc). For more
detail, see [15], keeping in mind that the intercept basis function N(xc) = 1 for each
individual complementary statistic xcin our case is omitted from the basis due to
being folded into the overall model’s intercept. We chose to use K= 5 knots placed at
0.00-, 0.25-, 0.50-, 0.75- and 1.00-quantiles, providing just enough flexibility to capture
any clear non-linearity, while decreasing chances of overfitting and low interpretability
that come with overly flexible fits. That results into each complementary statistic xc
being represented by four basis functions, with its partial effect on response calculated
via a linear combination of these functions.
4

摘要:
展开>>
收起<<
PartiallyConstrainedGroupVariableSelectiontoAdjustforComplementaryUnitPerformanceinAmericanCollegeFootballA.SkripnikovaaNewCollegeofFlorida,Sarasota,FL34243,USAARTICLEHISTORYCompiledOctober25,2022ABSTRACTGiventheimportanceofaccurateteamrankingsinAmericancollegefootball(CFB)-duetoheavytitleandplayo i...
声明:本站为文档C2C交易模式,即用户上传的文档直接被用户下载,本站只是中间服务平台,本站所有文档下载所得的收益归上传人(含作者)所有。玖贝云文库仅提供信息存储空间,仅对用户上传内容的表现方式做保护处理,对上载内容本身不做任何修改或编辑。若文档所含内容侵犯了您的版权或隐私,请立即通知玖贝云文库,我们立即给予删除!
相关推荐
-
曲一线系列初中《5中考3年模拟》2023专题解释全国道德与法治资料包05专题五 走进社会生活 遵守社会规则VIP免费

 2024-11-21 24
 -
曲一线系列初中《5中考3年模拟》2023专题解释全国道德与法治资料包05专题五 走进社会生活 遵守社会规则VIP免费

 2024-11-21 24
 -
曲一线系列初中《5中考3年模拟》2023专题解释全国道德与法治资料包03专题三 青春时光 做情绪情感的主人VIP免费
 2024-11-21 16
 -
曲一线系列初中《5中考3年模拟》2023专题解释全国道德与法治资料包03专题三 青春时光 做情绪情感的主人VIP免费

 2024-11-21 22
 -
曲一线系列初中《5中考3年模拟》2023专题解释全国道德与法治资料包02专题二 友谊的天空 师长情谊VIP免费
 2024-11-21 19
 -
曲一线系列初中《5中考3年模拟》2023专题解释全国道德与法治资料包02专题二 友谊的天空 师长情谊VIP免费
 2024-11-21 20
 -
曲一线系列初中《5中考3年模拟》2023专题解释全国道德与法治资料包01专题一 成长的节拍 生命的思考VIP免费
 2024-11-21 25
 -
曲一线系列初中《5中考3年模拟》2023专题解释全国道德与法治资料包01专题一 成长的节拍 生命的思考VIP免费
 2024-11-21 24
 -
曲一线系列初中《5中考3年模拟》2023专题解释全国道德与法治资料包《53中考》全国道德与法治资料包VIP免费
 2024-11-21 27
 -
曲一线系列初中《5中考3年模拟》2023专题解释全国道德与法治资料包07专题七 坚持宪法至上 崇尚法治精神VIP免费
 2024-11-21 19
分类:图书资源
价格:10玖币
属性:18 页
大小:540.73KB
格式:PDF
时间:2025-05-02
作者详情
相关内容
-
2025届重庆市西南大学附属中学高三下学期5月全镇模拟物理试题(含答案)
分类:中学教育
时间:2025-12-31
标签:无
格式:PDF
价格:10 玖币
-

2025届重庆市西南大学附属中学高三下学期5月全镇模拟化学试题(含答案)
分类:中学教育
时间:2025-12-31
标签:无
格式:PDF
价格:10 玖币
-
2025届浙江省新阵地联盟高三10月联考数学答案
分类:中学教育
时间:2025-12-31
标签:无
格式:PDF
价格:10 玖币
-
2025届重庆市西南大学附属中学高三下学期5月全镇模拟数学试题(含答案)
分类:中学教育
时间:2025-12-31
标签:无
格式:PDF
价格:10 玖币
-

2025届重庆康德三诊英语+答案
分类:中学教育
时间:2026-01-03
标签:无
格式:PDF
价格:10 玖币

