
Estimating psychometric functions from adaptive designs_2
2025-04-29
0
0
560.62KB
21 页
10玖币
侵权投诉

Estimating psychometric functions from adaptive designs
Simon Bang Kristensen1,2∗Katrine Bødkergaard1,3
Bo Martin Bibby1
1Research Unit for Biostatistics,
Department of Public Health, Aarhus University
2Research Unit OPEN, Department of Clinical Research, University of Southern Denmark,
3Department of Clinical Epidemiology, Aarhus University
Keywords: adaptive designs; psychometric function; slope bias.
Abstract
An adaptive design adjusts dynamically as information is accrued and a consequence of ap-
plying an adaptive design is the potential for inducing small-sample bias in estimates. In
psychometrics and psychophysics, a common class of studies investigate a subject’s ability to
perform a task as a function of the stimulus intensity, meaning the amount or clarity of the
information supplied for the task. The relationship between the performance and intensity
is represented by a psychometric function. Such experiments routinely apply adaptive de-
signs, which use both previous intensities and performance to assign stimulus intensities, the
strategy being to sample intensities where the information about the psychometric function is
maximised. Similar schemes are often applied in drug trials to assign doses dynamically using
doses and responses from earlier observations. The present paper investigates the influence
of adaptation on statistical inference about the psychometric function focusing on estimation,
considering both parametric and non-parametric estimation under both fixed and adaptive
designs in schemes encompassing within subject independence as well as dependence through
random effects. We study the scenarios analytically, focussing on a latent class model to de-
rive results under random effects, and numerically through a simulation study. We show that
while the asymptotic properties of estimators are preserved under adaptation, the adaptive
nature of the design introduces small-sample bias, in particular in the slope parameter of the
psychometric function. We argue that this poses a dilemma for a study applying an adaptive
design in the form of a trade-off between more efficient sampling and the need to increase the
number of samples to ameliorate small-sample bias.
1 Introduction
A psychometric function is meant to represent a subject’s ability to perform a task as a function
of the difficulty of the task or the clarity of the presented stimulus. For example, a single trial
may ask a participant to identify the geometric shape presented in an image, when the image is
shown for a certain number of milliseconds (the intensity of the stimulus). Thus, the stimulus
intensity may be thought of as inverse to the task’s difficulty. Usually a number of trials are
performed over a range of intensities in what may be said to constitute a “vanilla” experiment.
The purpose of the study is then often centred on some aspect of these experiments, for example
comparing performance between groups (e.g. patients and controls), or within person by altering
some experimental configuration. As there is a natural upper limit for the time a participant can
engage in an experiment a fair amount of attention has focused on making the sampling in the
experiment efficient so as to increase the number of configurations, which is usually the focus of
the study. In the following we will focus on a “vanilla” experiment and the methods to efficiently
∗Correspondance should be sent to Simon Bang Kristensen, Odense University Hospital, Heden 16, 5000 Odense,
DK-Denmark, sbmkristensen@health.sdu.dk.
1
arXiv:2210.05199v1 [stat.ME] 11 Oct 2022

2Kristensen, Bødkergaard & Bibby
sample stimulus intensities and we will investigate the consequences to statistical inference, in
particular estimation and bias.
The need for flexible sampling leads to the concept of adaptive designs, which is by no means
a concept unique to cognitive experiments but to most types of clinical trials. That the design
is adaptive means that the design may change dynamically during the trial, usually based on
the observed design and possibly outcomes up to a certain time. For example, a biased coin
design (Efron, 1971) tries to make the groups in a randomised trial equally large by adapting the
randomisation probability depending on the current allocation of experimental units – thus using
the design but not the outcome at a given step. This is contrary to a classic, fixed design (also
see Dawid and Didelez, 2010) where the trial structure is determined before the trial begins – for
example by setting the probability to be allocated to either group to 1/2 and thereby running
the risk of very unbalanced groups when the number of randomised subjects is small. A classic
use of outcome adaptive designs occurs in group sequential designs (e.g. Jennison and Turnbull,
1999) where one will allow for a trial to stop at an interim stage if the obtained data show strong
evidence against the null hypothesis (stopping for efficacy) or if it seems likely that the trial will
have a inconclusive outcome (stopping for futility). It is generally accepted that designs using
the outcome for example in an interim analysis must account for this in the analysis phase, one
problem being the increased type I error rate due to multiple testing, another being the bias of the
estimates (confidence intervals must also be produced using special methods). For example, in a
drug trial with an interim analysis stopping for efficacy because the observed effect of the drug is
very large, the na¨ıve estimate of the drug effect will be biased upwards.
In psychometrics and psychophysics, the adaptation uses both the outcome and the design.
Simply put, the problem is that if the stimulus intensities are chosen too low or too high, the
observed accuracies will be almost all zeros or ones leading to poor estimates of the psychometric
function. Thus, we would like to sample where there is more information about the psychometric
function. As these accuracies are specific to a participant and there is no way to know the partic-
ipant’s level of accuracy before the experiment, the design needs to adapt based on the previous
intensities along with the previous performance. Various designs have been proposed as reviewed
for example in Treutwein (1995) and Leek (2001), the simplest of which adapt the stimulus intensity
at a given time from the previous intensity based on the performance a few trials back.
Estimates from adaptive designs will usually inherit the asymptotic properties of those from the
fixed sample design (e.g. Melfi and Page, 2000). However, this does not account for the behaviours
in small samples and while there is acknowledgement for the need to account for these in the
medical trial literature this does not seem common in psychometrics (cf. for instance section 3.4.2
and 5.4.2 of the textbook Kingdom and Prins (2016)). As also highlighted by Bretz et al. (2009)
testing and the control of type I error rates are much better understood than estimation in adaptive
designs.
The article proceeds as follows. We first give a brief overview of some standard methods
for adaptive stimulus allocation. We then introduce the basic setup for the paper introducing
the concepts of psychometric functions along with notation for designs and dependence schemes,
before investigating the likelihoods as the basis of inference and estimation. We perform these
investigations both in designs employing adaptive and non-adaptive allocation as well as under
within-subject independence and dependence through the inclusion of random effects. Finally, we
illustrate these points through a simulation study followed by a brief discussion.
1.1 Brief overview of adaptive methods
In the following we give a brief review of methods used in psychometrics and psychophysics for
constructing adaptive designs (see Treutwein, 1995; Leek, 2001, for a more complete and in-depth
treatment). As there is substantial overlap with the literature on dose finding designs, we include
a few references from the related literature and make some comparisons.
The simplest class of adaptive designs assigns the next stimulus intensity from the current
intensity based on the performance of the subject a few trials back. This includes the up-down
design (Dixon and Mood, 1948) in which the stimulus is increased from the current intensity if the
current response was incorrect and decreased if the response was correct. This procedure targets
the accuracy probability 1/2. If the purpose of the study is to estimate some other quantile of
the psychometric function, this may constitute a disadvantage. Other designs may be employed to
target different accuracies, e.g. the one-up-two-down design will decrease the intensity only after
two consecutive correct responses and target the probability 1/√2=0.71. A more general approach
Estimating psychometric functions from adaptive designs 3
are the so-called weighted up-down methods, where rather than altering the number of correct
responses before decreasing the intensity, the weighted up-down designs employ differential up and
down stepsizes depending on the target probability. Note that these designs are all characterised by
the fact that they will find the intensity corresponding to the target probability and then fluctuate
around this level, not converging. Moreover, the stepsize when adjusting the intensity is fixed
across trials.
Stochastic approximation schemes similarly use differential up and down step sizes depending
on the target probability but further decreases the step sizes with the number of trials. This leads
to convergence to the target probability.
A more involved class of adaptive methods utilises a broader range of the information from the
previous trials. The method may be summarised as performing maximum likelihood estimation of
the parameters of the psychometric function following each trial using all available information on
responses and stimulus intensities up to that point. Based on predictions from these estimates, a
next stimulus intensity is chosen that in some way adds the most information. The procedure is
known in psychophysics as “best PEST” following Pentland (1980), who proposed it building on
a series of more ad hoc methods known as PEST (Parameter Estimation by Sequential Testing).
In the dose-finding literature, the adaptive methods also commonly include up-down type
designs as well as stochastic approximation and sequential maximum likelihood is also often done,
see O’Quigley and Chevret (1991) for a review. There, the latter method is termed the continual
reassessment method (CRM) (O’Quigley et al., 1990; O’Quigley and Shen, 1996).
In proposing the CRM, O’Quigley et al. (1990) suggest the use of a prior (advocating for a
weak prior) on the does-response parameters, thus setting the method in a Bayesian framework
so that the next stimulus intensity is determined by maximising the posterior distribution rather
than the likelihood. The “best PEST” does not make such assumptions, but requires a burnin
period or reverting to other methods when likelihood estimation fails. This is realistic in most
psychophysics procedures where there are typically many trials per subject, but not so in designs
such as those considered by O’Quigley et al. (1990), where there may only be 20 patients included,
each tested once. Thus, the adding of a prior lends additional numerical stability.
A Bayesian version of the “best PEST” is given by Watson and Pelli (1983). Kontsevich
and Tyler (1999) further study a problem of estimating the threshold while regarding the slope
parameter as a “nuisance” parameter. Targeting specific parameters of the psychometric function
while accounting for the other parameters is related to so-called psi-methods, which we do not
elaborate on here (see Kingdom and Prins, 2016, Section 5.4 for an overview).
2 Basic theory
We first introduce some notation. Let an observation be of the form (Y, S) where Y∈ {0,1}is the
accuracy and Sis the stimulus intensity taking values in a finite set S. Suppose that intensities are
equidistant and we will assume without loss of generality that S={1, . . . , D}. Observations are
taken for i= 1, . . . , N subjects at t= 1, . . . , T time points leading to the data {(Yit, Sit)}. Note
that we simplistically assume that Tis fixed, meaning that there is no data dependent stopping,
and that all subjects participate in the same number of trials. Write (Yi,Si) for the combined
vector of observations on subject i. Further, when Wis some random variable we will write fW
for its density.
2.1 Psychometric functions
It is convenient first to regard the design as being fixed so that we may either consider the intensities
as fixed or as ancillaries (see below). A simple psychometric function model for the accuracy given
the intensity would be,
M(a):Yit Sit ∼b (1, F (Sit;θ)) ,(1)
so that the accuracy is a Bernoulli variable with a success probability depending on the stimulus in-
tensity. We assume that subjects are independent but postpone specification of the within-subject
dependence. The function Fis the psychometric function, which establishes the relationship
between the success probability and the intensity. θdenotes the parameters of the conditional
distribution of the response given the intensity, which is assumed to be the parameters of inter-
est. Let Ωθbe the domain for θ. In a simple case, Fcould be logistic x7→ 1 + e(x−˜a)/˜
b−1=

4Kristensen, Bødkergaard & Bibby
1 + e−(a+bx)−1, in which case θ= (a, b) would be the intercept and slope on the logistic scale.
Further, we will consider a random effects model,
M(b):Yit Sit,αi∼b (1, F (Sit;αi, θ)) ,(2)
where αiis the random effects for subject i. To fix ideas we will consider a logistic model with
random intercepts,
F(s;θ, αi) = 1
1 + e−(a+αi+b·s), αi∼N(0, τ2),(3)
where θ= (a, b).
Parametric and non-parametric models
We will in the following discern two scenarios (as also done in Treutwein, 1995): The parametric
scenario where, as outlined above, we assume a specific form of the psychometric function with
the objective of estimating the parameters, for example the logistic function in (3). We will also
consider the non-parametric scenario, where we wish to estimate accuracy probabilities at given
intensities, i.e. πs=F(s) for s∈ S and some unknown function F.
2.2 Fixed designs
The simplest approach to choosing the stimulus intensity in a series of trials is to take them to
be random in the set Swith distribution fS. For example, the intensities may be sampled to
be uniformly random or could be Gaussian to sample the majority of intensities close to some
prespecified intensity. As the intensities in this case may simply be determined before the trial,
we term this the fixed design, as the intensities are determined before the study begins. We will
denote by ψ∈Ωψany parameters of the distribution of the stimulus intensities.
2.3 The up-down design
As described in Section 1.1 the up-down design samples the stimulus in a given trial based on
the intensity and performance of the previous trial. Recall that the intensities take values in
S={1, . . . , D}. For participant i, randomise Si1uniformly in Sand set
Sit =
1 if Si(t−1) −2·Yi(t−1) −1= 0
Si(t−1) −2·Yi(t−1) −1else
Dif Si(t−1) −2·Yi(t−1) −1=D+ 1
(4)
for t= 2, . . . , T . The resulting allocation of the stimulus intensities is called the up-down design.
2.4 Individual versus group level analyses
In the following we limit our discussion to an analysis strategy in which the aim is to analyse the
entire set of data once it is collected, which we refer to as a group level analysis. In practice,
another strategy is sometimes applied in which the data is analysed on an individual level to
obtain estimates ˆ
θ1,...,ˆ
θNwhich are then analysed, usually in a multiple regression model. In
the vanilla experiment described in the Introduction where we only consider data collected from one
experimental configuration under various intensities, we might in the second stage be interested
in the expectation of the parameter of interest, and take the estimator simply to be the mean
(analogously to an intercept-only “multiple” regression),
ˆ
θ=1
N
N
X
i=1
ˆ
θi.(5)
Naturally, this two-stage estimator is less efficient than the one that arises from using all the
data. Additionally, it tacitly relies on an assumption of normality of the estimates around the
true parameter, which may not be true in small samples. Indeed, as we shall elaborate on, if
an adaptive design is applied, the adaptation will imply a bias in small samples even in cases
that one would expect to be unbiased as in the fixed design. The distinction between group and

Estimating psychometric functions from adaptive designs 5
individual level analysis bears importance as the random effects model introduced in Section 2.1
models between-participant variation while enabling estimation of the parameters of interest, but
the random effects would not be identifiable in the individual level analysis.
Finally, note that the individual level estimates are used by the continual reassessment method
described in Section 1.1 to update the stimulus intensity. We would still, however, apply an analysis
of all the data once it has been collected in its entirety.
2.5 Dependence schemes
Below we introduce within-subject dependence schemes, which depend on the basic model for
the accuracy given the stimulus intensity as introduced in Section 2.1 as well as the design of the
stimulus allocation. We consider the usual fixed design case along with the up-down design with no
random effects as well as the fixed and up-down designs with random effects. We will use so-called
directed acyclic graphs (DAGs) to represent the dependence structure in the various schemes. The
theory of such graphs is well developed (e.g. Lauritzen, 1996) and we do not presume to reiterate
it here. Rather, we will rely on intuitive arguments based on these. A more formal algorithm for
reading conditional independence from a DAG is given in Appendix B. An important assumption
is that the graph accurately encodes the dependence of the scheme.
Scheme 1: Fixed design (FD and FDr)
We first consider a model, where a single observation follows the simple psychometric function
model M(a)in (1). The intensities are sampled using a design that was fixed at the beginning of
the experiment with no adaptation, see Section 2.2. Denote this by FD, as illustrated in Figure 1.
St−1
Yt−1
St
Yt
St+1
Yt+1
. . .. . .
Figure 1: Scheme FD: Fixed design with no random effects.
We also use the same scheme but under the assumption that the observations are conditionally
independent given the intensity and a subject level random effect, cf. the model M(b)in (2). We
call this FDr, where the subscript indicates the presence of a random effect, see Figure 2.
St−1
Yt−1
St
Yt
St+1
Yt+1
. . .
. . .
α
Figure 2: Scheme FDr: Fixed design with random effects.
Scheme 2: Up-down design (UD and UDr)
Consider also the basic model Main (1) but with an up-down design as described in Section 2.3.
This is the scheme UD, as illustrated in Figure 3. Here, the stimulus intensity is determined at
time tby the previous intensity along with the previous response.

摘要:
展开>>
收起<<
EstimatingpsychometricfunctionsfromadaptivedesignsSimonBangKristensen1;2*KatrineB dkergaard1;3BoMartinBibby11ResearchUnitforBiostatistics,DepartmentofPublicHealth,AarhusUniversity2ResearchUnitOPEN,DepartmentofClinicalResearch,UniversityofSouthernDenmark,3DepartmentofClinicalEpidemiology,AarhusUniver...
声明:本站为文档C2C交易模式,即用户上传的文档直接被用户下载,本站只是中间服务平台,本站所有文档下载所得的收益归上传人(含作者)所有。玖贝云文库仅提供信息存储空间,仅对用户上传内容的表现方式做保护处理,对上载内容本身不做任何修改或编辑。若文档所含内容侵犯了您的版权或隐私,请立即通知玖贝云文库,我们立即给予删除!
相关推荐
-
曲一线系列初中《5中考3年模拟》2023专题解释全国道德与法治资料包05专题五 走进社会生活 遵守社会规则VIP免费

 2024-11-21 24
 -
曲一线系列初中《5中考3年模拟》2023专题解释全国道德与法治资料包05专题五 走进社会生活 遵守社会规则VIP免费
 2024-11-21 24
 -
曲一线系列初中《5中考3年模拟》2023专题解释全国道德与法治资料包03专题三 青春时光 做情绪情感的主人VIP免费
 2024-11-21 16
 -
曲一线系列初中《5中考3年模拟》2023专题解释全国道德与法治资料包03专题三 青春时光 做情绪情感的主人VIP免费
 2024-11-21 22
 -
曲一线系列初中《5中考3年模拟》2023专题解释全国道德与法治资料包02专题二 友谊的天空 师长情谊VIP免费
 2024-11-21 19
 -
曲一线系列初中《5中考3年模拟》2023专题解释全国道德与法治资料包02专题二 友谊的天空 师长情谊VIP免费
 2024-11-21 20
 -
曲一线系列初中《5中考3年模拟》2023专题解释全国道德与法治资料包01专题一 成长的节拍 生命的思考VIP免费
 2024-11-21 25
 -
曲一线系列初中《5中考3年模拟》2023专题解释全国道德与法治资料包01专题一 成长的节拍 生命的思考VIP免费
 2024-11-21 24
 -
曲一线系列初中《5中考3年模拟》2023专题解释全国道德与法治资料包《53中考》全国道德与法治资料包VIP免费
 2024-11-21 27
 -
曲一线系列初中《5中考3年模拟》2023专题解释全国道德与法治资料包07专题七 坚持宪法至上 崇尚法治精神VIP免费
 2024-11-21 19
分类:图书资源
价格:10玖币
属性:21 页
大小:560.62KB
格式:PDF
时间:2025-04-29
作者详情

相关内容
-
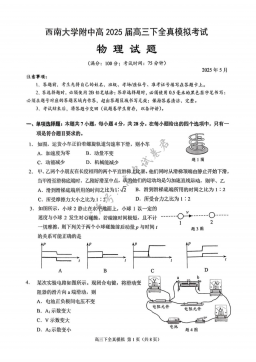
2025届重庆市西南大学附属中学高三下学期5月全镇模拟物理试题(含答案)
分类:中学教育
时间:2025-12-31
标签:无
格式:PDF
价格:10 玖币
-

2025届重庆市西南大学附属中学高三下学期5月全镇模拟化学试题(含答案)
分类:中学教育
时间:2025-12-31
标签:无
格式:PDF
价格:10 玖币
-
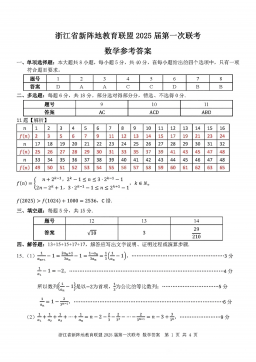
2025届浙江省新阵地联盟高三10月联考数学答案
分类:中学教育
时间:2025-12-31
标签:无
格式:PDF
价格:10 玖币
-

2025届重庆市西南大学附属中学高三下学期5月全镇模拟数学试题(含答案)
分类:中学教育
时间:2025-12-31
标签:无
格式:PDF
价格:10 玖币
-

2025届重庆康德三诊英语+答案
分类:中学教育
时间:2026-01-03
标签:无
格式:PDF
价格:10 玖币

