
Sub-millimetre wave range -Doppler radar as a diagnostic tool for gas -solids systems - solids concentration measurements Marlene Bonmanna Diana Carolina Guío -Pérezb Tomas Bryllerta David Pallarèsb Martin Seemannb Filip Johnssonb Jan
2025-05-02
0
0
995.22KB
18 页
10玖币
侵权投诉
Sub-millimetre wave range-Doppler radar as a diagnostic tool for gas-solids systems - solids
concentration measurements
Marlene Bonmanna, Diana Carolina Guío-Pérezb, Tomas Bryllerta, David Pallarèsb, Martin Seemannb, Filip Johnssonb, Jan
Stakea
a Department of Microtechnology and Nanoscience, Terahertz and Millimetre Wave Laboratory
Chalmers University of Technology, SE-412 96 Gothenburg, Sweden
b Department of Space, Earth and Environment, Division of Energy Technology
Chalmers University of Technology, SE-412 96 Gothenburg, Sweden
Abstract
Current non-intrusive measurement techniques for characterising the solids flow in gas-solids suspensions are
limited by the low temporal or low spatial resolution of the sample volume, or in the case of optical methods, by
a short range of sight. In this work, a sub-millimetre wave range-Doppler radar is developed and validated for non-
intrusive sensing of solids concentrations in a gas-solids particle system with known characteristics. The radar system
combines favourable features, such as the ability to see through at optical frequencies opaque materials, to measure
the local solids velocity and the reflected radar power with a spatial resolution of a few cubic centimetres over
distances of a few metres. In addition, the radar hardware offers flexibility in terms of installation. After signal
processing, the output of the radar is range-velocity images of the solids flowing along the radar’s line-of-sight. The
image frame rate can be close to real-time, allowing the solids flow dynamics to be observed.
While the well-established Doppler principle is used to measure the solids velocity, this paper introduces a method
to relate the received radar signal power to the solids volumetric concentrations () of different particulate
materials. The experimental set-up provides a steady stream of free-falling solids that consist of glass spheres, bronze
spheres or natural sand grains with known particle size distributions and with particle diameters in the range of 50–
300 µm. Thus, the values of found using the radar measurements are validated using the values of retrieved
from closure of the mass balance derived from the measured mass flow rate of the solids stream and the solids
velocity. The results show that the radar system provides reliable measurements of , with a mean relative error of
approximately 25% for all the tested materials, particle sizes and mass flow rates, yielding values of ranging from
0.2×10⁻⁴ m3/m3 up to 40×10-4 m3/m3 and solids velocities within the range of 0–4.5 m/s. This demonstrates the
ability of the radar technology to diagnose the solids flow in gas-solids suspensions using a unique combination of
penetration length, accuracy, and spatial and velocity resolution. In future work, the radar technique will be applied
to study non-controlled solids flow at a larger scale, and to understand flow conditions relevant to industrial reactor
applications, e.g., fluidised bed, entrained flow, and cyclone units.
Keywords: sub-millimetre wave, Doppler radar, FMCW-pulse Doppler radar, gas-solids flow, solids concentration
measurement, particle velocity measurement
1. Introduction
In a wide range of industrial processes, the transport and mixing of gas-solids phases play essential roles. These
processes range from the pneumatic transport of particulate materials in, for example, food processing [1] and
pharmaceutics [2], to the fluidised bed technology used, for example, in combustion plants [3]. Measuring the
velocities and concentrations of solids is essential for understanding the mechanisms that govern the solids flow and
for validation of numerical modelling approaches [4, 5] that attempt to describe the complex gas-solids dynamics.
Ideally, a measurement technique to diagnose the solids flow in a gas-solids suspension should:
(i) Be non-intrusive, avoiding the insertion of objects that affect the solids flow to be measured.
(ii) Resolve the dynamics of the flow. It should provide sufficiently high resolutions in the time (time-scales longer
than 10-1 s cover most of the power spectra of fast gas-solids flows (see for example [6]) and space (with particle
scale length being the ultimate target) dimensions.
(iii) Provide penetration into the gas-solids suspension so that the flow can also be diagnosed in locations that lack
optical access.
(iv) Be sufficiently robust to withstand the harsh erosional (and sometimes corrosive) flow conditions.
(v) Be associated with a low cost of implementation.

Among the non-intrusive techniques currently available, the most commonly used are time-averaged pressure
measurements, from which the axial profiles of the cross-sectional average concentrations of solids can be obtained
with a spatial resolution that ranges from decimetres to several metres (e.g., [7]). Specific characteristics, such as
bubble dynamics and regime changes, can be extracted from time-resolved pressure measurements (e.g., [8], [9],
and [10]). Some non-intrusive tomographic techniques applied in gas-solid systems involve x-rays, γ-rays, electrical
capacitance, and phase-Doppler anemometers. They can be used for mapping solids flow (velocity, concentration,
or both) in narrow bench-scale units with a spatial resolution in the order of a few centimetres [11, 12, 13 and
references therein, 14]. Such dynamic tomographic measurements have limited applicability to large-scale units,
owing to the higher integrated absorption of the signal and the rapidly increasing number of sensor pairs needed to
retain the same level of spatial resolution. In addition, the intended positioning of the sensor pairs is often restricted
by geometric constraints, which may reduce the flexibility and accuracy of the technique. Moreover, the
measurement accuracy largely depends on the reconstruction algorithm. Direct tracking techniques, such as
electrostatic induction sensors or particle image velocimetry (PIV) [15, 12], offer higher spatial resolution (1 mm).
However, these techniques are restricted to measurements of flows at moderate temperatures and are limited by
the need for an optically free line-of-sight to the measurement volume. Therefore, solids velocity measurements
made with electrostatic induction sensors or particle image velocimetry PIV are rarely used for dense flows.
Radar technology combines several of the desired properties listed above, in that it is non-invasive, has long
penetration lengths, and excellent velocity and spatial resolutions. Some authors [16, 17] have demonstrated non-
intrusive measurements of multi-disperse solids streams using a multi-static dual-frequency (91.5 GHz, 150.3 GHz)
radar system. They observed proportionality between the solids mass load and reflected signal power. The radar
technique has also been used to measure particle size distributions (). Even though the radar mode cannot
measure the velocity of the solids, Baer and co-workers [18] have demonstrated that two 80-GHz frequency-
modulated continuous-wave (FMCW) radars can be used to find the cross-sectional average concentration of the
solids volume fraction and velocity across a 200-mm-wide conveying installation. The
cv
is derived from the time
of flight of the radar signal and the velocity from two-point measurements using the correlation between the two
radar signals along the solids flow. However, the configurations involving two transmitter-receiver sets and several
radars, respectively, require accurate radar alignment, making them less-suitable for performing measurements in
industrial units. Furthermore, the spatial resolution is restricted, being defined by the overlap of the two radar beams
[16, 17] and across the whole 200-mm tube [18].
Radar systems that utilise only one antenna for transmitting and receiving the radar signals operating in pulsed-
FMCW mode offer an alternative to overcome the complication of radar antenna alignment and to allow (besides
local solids concentration measurements) for local solids velocity measurements using the Doppler principle.
Cooper and Chattopadhyay [19] have described a 680-GHz radar that can simultaneously monitor the distance and
velocity of small solids particles in a sandstorm. However, the radar was not adapted for industrial applications.
The recently developed radar technology with sub-millimetre wave frequencies (325–350GHz) [20] offers high
spatial resolution and has a relatively compact footprint (40×30×20 cm3). Thus, it allows the performance of
measurements while pointing the radar beam in any desired direction and simplifies the installation for industrial
measurements. In addition, it operates at higher frequencies than previous radar systems [16, 17, 18]. In the case of
the 680-GHz radar used previously [19], this increases the measurement sensitivity for smaller solids particles and
increases the spatial resolution. At the same time, the radar operates below optical frequencies (400–750 THz),
which means that the radar beam has a greater depth of penetration than optical measurement methods. Therefore,
this sub-millimetre wave radar technology is highly promising for non-intrusive monitoring of solids concentrations
and velocities, allowing the characterisation of volumes in the order of 10-3 m3 (resulting from a beam cross-section
in the order of 0.01–0.1 m2 and a spatial resolution along the direction of the beam of 10-2 m), with a velocity
resolution in the order of 10-2 m/s and a time resolution of 10-2 s (frame rate in the order of 10–100 Hz). The
abilities of FMCW-pulse Doppler radar systems to measure accurately the velocities of objects are generally accepted
and, specifically for the radar system used in this work, have been previously reported in the literature [20]. Thus,
there is a need to verify the ability of such radar systems to measure accurately the solids concentrations, thereby
providing an all-in-one measurement of the solids flux.
The aim of this work was to evaluate the use of radar technology as a diagnostic tool for the characterisation
of solids flows. Here, the 340–GHz sub-millimetre wave FMCW-pulse Doppler radar system described previously
[20] is used to measure the solids velocity and concentration along a free-falling solids stream with known mass
flow rate, stream diameter and solids properties. Radar-based measurements of the solids concentration are
compared to their corresponding reference values calculated from closure of the mass balance using the values of
the measured mass flow rate and the solids velocity (obtained through the Doppler method and, thus, considered
to be reliable). The radar measurement is tested with solids of different sizes, shapes, and material/dielectric constants
and with varying solids concentrations.

2. Theory
Figure 1 illustrates the general principle of a radar beam intersecting a gas-solids suspension, where the geometrical
dimensions of the gas-solids suspension with solids volume concentration exceeds the radar beam-width
, where is the distance (range) to the radar antenna and is the angular beam-width. The radar
beam-width defines the cross-range resolution of the radar, whereas the spatial resolution in the propagation
direction of the radar beam is determined by the range resolution , thereby yielding the sample volume
for a given range increment. For each , the solids velocity distribution and are measured.
The solids velocity is indicated by
v
, the Doppler velocity, whereas is measured by the radar and is the projection
towards the radar (i.e., radial velocity).
Figure 1. Radar beam intersecting a gas-solids suspension.
The radar signal is transmitted and then reflected back to the radar antenna by the solids. The relationship
between the reflected signal power and is derived from the radar equation. The radar equation [21] expresses
the signal power reflected from an individual scatterer:
, (1)
where is the peak transmit power, is the antenna gain, is the wavelength of the signal, and is the back-
scattering cross-section.
The back-scattering cross-section for an individual solids particle with radius is calculated as:
(2)
where is the back-scattering efficiency calculated using the Mie theory formalism for an approximately spherical
particle [22]. However, when the radar beam intersects a solids cloud all the individual solids particles within the
radar beam contribute to the total back-scattering cross-section, . Furthermore, multiple scattering effects,
i.e., the impact of second-order scattering of photons that do not leave the radar’s field-of-view after having
scattered once with solids in the radar beam, gain relevance as the solids concentration increases, thereby altering
the back-scattered signal. Multiple scattering effects are negligible for sub-wavelength-sized solids when the mean-
free path (inverse of the extinction coefficient) between scattering events is larger than the radar’s field-of-view
(radar footprint) [23]. Theoretically, for approximately wavelength-sized solids, Mishchenko et al. [24] have
estimated a solids volume fraction of 2.4×10⁻³ as a rough threshold value for validity. The suspensions diagnosed in
this work fulfil most often this criterion, as discussed in the
Results
section. Thus, neglecting multiple scattering
effects, the total back-scattering cross-section can be expressed as:
, (3)

where is the solids number concentration (the number of solids particles per unit volume), and is the
PSD function.
As the radar beam is travelling through the gas-solids suspension, it is reflected. It travels back to the radar
antenna, experiencing two-way attenuation due to extinction (scattering and absorption). The intensity of the radar
beam,, is reduced according to [22, 25]:
, (4)
where is the attenuation coefficient and is the range interval that the beam has travelled. The attenuation
coefficient is related to the total extinction cross-section, as . The extinction cross-
section for an individual solid particle with radius can be calculated as:
, (5)
with being the extension efficiency of an individual solid particle calculated using the Mie formalism, and,
neglecting multiple scattering effects, the for the gas-solids suspension is:
(6)
However, when making a compromise between the control of the conducted measurements and the size of
the measurement set-up, it should be noted that under experimental conditions, as in this work, the radar beam
with radius is not always fully immersed in a solids stream with radius throughout the whole
measured distance (i.e.,
rradar
>
rstream
in some regions, see details in Section 3). This violates the requirement for the
applicability of Eq. (4). To correct for this, the first right-hand side term of Eq. (1) is introduced. In addition, a
scaling factor is introduced in the attenuation term to scale . Furthermore, in a real radar system, several
additional factors influence the measurement, such as the radar hardware components (the gain in receiver
amplifiers, loss in wires, filters, and antennas) and signal gain and losses introduced by the digital signal processing
needed to extract the velocity and range data. As these factors are generally not known with sufficient precision,
the radar instrument needs to be calibrated to estimate the absolute values of the solids concentration (for details of
the calibration, see Section 3.2.2). In summary, calibration allows the incorporation of all of the above into a single
factor,.
With all the considerations mentioned above, Eq. (1) is re-written as:
(7)
As the last step, the measured solids volume fraction can be calculated as:
(8)
where the solids mean volume is given by:
. (9)
3. Methodology
The following sub-sections describe the procedure for validating the radar measurements of solids
concentrations, the experimental set-up for establishing a controlled solids stream, the radar system and its
calibration.
3.1 Validation procedure
The radar measures the reflected power along a solids stream with mass flow rate . For a stable and steady flow
of solids, the relationship between and is given by closure of the mass balance:

摘要:
展开>>
收起<<
Sub-millimetrewaverange-Dopplerradarasadiagnostictoolforgas-solidssystems-solidsconcentrationmeasurementsMarleneBonmanna,DianaCarolinaGuío-Pérezb,TomasBryllerta,DavidPallarèsb,MartinSeemannb,FilipJohnssonb,JanStakeaaDepartmentofMicrotechnologyandNanoscience,TerahertzandMillimetreWaveLaboratoryChalme...
声明:本站为文档C2C交易模式,即用户上传的文档直接被用户下载,本站只是中间服务平台,本站所有文档下载所得的收益归上传人(含作者)所有。玖贝云文库仅提供信息存储空间,仅对用户上传内容的表现方式做保护处理,对上载内容本身不做任何修改或编辑。若文档所含内容侵犯了您的版权或隐私,请立即通知玖贝云文库,我们立即给予删除!
相关推荐
-
曲一线系列初中《5中考3年模拟》2023专题解释全国道德与法治资料包05专题五 走进社会生活 遵守社会规则VIP免费

 2024-11-21 24
 -
曲一线系列初中《5中考3年模拟》2023专题解释全国道德与法治资料包05专题五 走进社会生活 遵守社会规则VIP免费
 2024-11-21 24
 -
曲一线系列初中《5中考3年模拟》2023专题解释全国道德与法治资料包03专题三 青春时光 做情绪情感的主人VIP免费
 2024-11-21 16
 -
曲一线系列初中《5中考3年模拟》2023专题解释全国道德与法治资料包03专题三 青春时光 做情绪情感的主人VIP免费
 2024-11-21 22
 -
曲一线系列初中《5中考3年模拟》2023专题解释全国道德与法治资料包02专题二 友谊的天空 师长情谊VIP免费
 2024-11-21 19
 -
曲一线系列初中《5中考3年模拟》2023专题解释全国道德与法治资料包02专题二 友谊的天空 师长情谊VIP免费
 2024-11-21 20
 -
曲一线系列初中《5中考3年模拟》2023专题解释全国道德与法治资料包01专题一 成长的节拍 生命的思考VIP免费
 2024-11-21 25
 -
曲一线系列初中《5中考3年模拟》2023专题解释全国道德与法治资料包01专题一 成长的节拍 生命的思考VIP免费
 2024-11-21 24
 -
曲一线系列初中《5中考3年模拟》2023专题解释全国道德与法治资料包《53中考》全国道德与法治资料包VIP免费
 2024-11-21 27
 -
曲一线系列初中《5中考3年模拟》2023专题解释全国道德与法治资料包07专题七 坚持宪法至上 崇尚法治精神VIP免费
 2024-11-21 19
分类:图书资源
价格:10玖币
属性:18 页
大小:995.22KB
格式:PDF
时间:2025-05-02
作者详情

相关内容
-
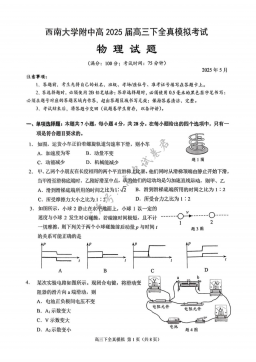
2025届重庆市西南大学附属中学高三下学期5月全镇模拟物理试题(含答案)
分类:中学教育
时间:2025-12-31
标签:无
格式:PDF
价格:10 玖币
-
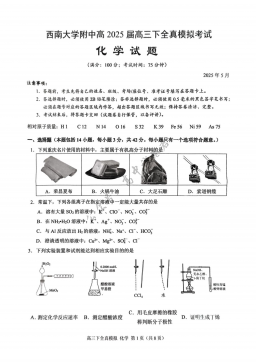
2025届重庆市西南大学附属中学高三下学期5月全镇模拟化学试题(含答案)
分类:中学教育
时间:2025-12-31
标签:无
格式:PDF
价格:10 玖币
-
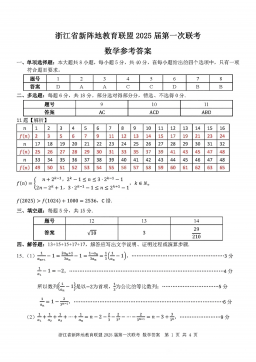
2025届浙江省新阵地联盟高三10月联考数学答案
分类:中学教育
时间:2025-12-31
标签:无
格式:PDF
价格:10 玖币
-
2025届重庆市西南大学附属中学高三下学期5月全镇模拟数学试题(含答案)
分类:中学教育
时间:2025-12-31
标签:无
格式:PDF
价格:10 玖币
-

2025届重庆康德三诊英语+答案
分类:中学教育
时间:2026-01-03
标签:无
格式:PDF
价格:10 玖币

